If you want to improve cost per ton, you first have to know how to measure it.
As part of the Business Solutions Group (BSG), my role is to help our customers maximize their production operations. Our team does this by visiting customers at their site where we observe how machines are being utilized at the operation. We take those notes, video and GPS data from our on-site visit, and then also look at any available Komtrax usage data to find ways to help improve productivity.
However, as we’ve traveled around the country and met with different customers, we’ve found that they measure costs and profitability in many different ways. And that’s a problem because without consistency in measurement, how do you know you’re improving?
BSG has found the best way to measure costs and assign a “productivity value” to a machine is by using the cost per ton metric. We’ve found this metric most useful because it includes all associated costs of running a machine on an hourly basis and compares that to the amount of material (tons) the machine is producing on an hourly basis. When you lower cost per ton, that machine is either producing more, costing the owner less to run and maintain, or both.
But, here’s the tricky part: even when using what appears to be the same metric of cost per ton, you have to make sure that the inputs (measurements) are the same, otherwise you won’t get an apples-to-apples comparison. So, if you’re comparing cost per ton as measured from one OEM to another, look carefully at the inputs to make sure they line up, otherwise, you aren’t measuring the same thing.
Our Business Solutions Group uses two main categories in our cost per ton calculations: costs and production values. For the purpose of this blog post (and our subsequent ones) this is how we will calculate cost per ton. Costs are directly related to another common metric, total cost of ownership (TCO).
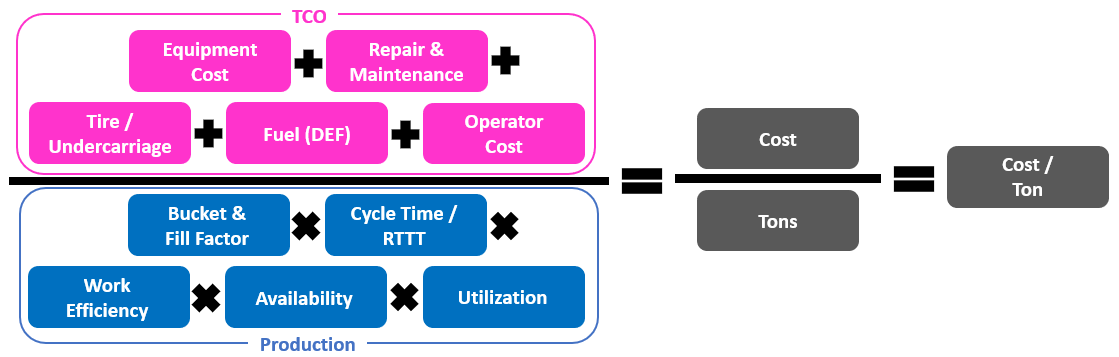
Costs include:
Equipment sale price
Repair & maintenance costs
Tire or undercarriage costs
Fuel costs (including DEF, if applicable)
Operator costs (It’s worth noting that some calculations only include the operator’s hourly rate. Others include a fully burdened cost that includes health insurance and other factors. Still others exclude operator costs from the equation entirely based on the assumption the operator is paid the same, regardless of the make of the equipment they are running.)
Production values can be more varied and include:
Bucket capacity
Bucket fill factor
Cycle time (for loading tools) or round-trip travel time (RTTT) for haul trucks
Work efficiency — This relates to the time a machine is supposed to be ”in the dirt” doing its primary job, and the percentage of time it is actually doing that job.
Availability — The amount of time a machine is capable of working. If a machine is being repaired, or maintenance is being performed, this subtracts from its availability.
Utilization — The amount of time a machine is scheduled to work. (For example, a grader that cleans haul roads once a week would have low utilization compared to a pit loader running every shift.)
Now that we have the definitions out of the way, the formula for cost per ton becomes relatively simple:
Calculation results may vary.
When we approach the equation like the above, it allows us to ask our customers some pretty straight-forward questions with the goal of reducing cost/ton. Now let’s put this equation to work using a WA600-8 wheel loader as an example.
Which is a more effective way to reduce cost/ton? By reducing fuel consumption by 10%, or reducing cycle time by 10%?
Komtrax data indicates the WA600-8 burns about 11.0 gallons/hour on average. A 10% reduction in fuel would reduce that to about 9.9 gallons/hour.
Let’s assume the loader’s cycle time is 45 seconds — the time it takes to dig, dump into the truck and return to its start point. A 10% reduction in cycle time would lower this to 40.5 seconds, which is still slightly above the industry average of 36 seconds.
Next, we index the current state (11 gal/hr & 45 sec cycle) at 100.0 in terms of cost/ton.
If all other factors are constant, reducing fuel consumption would lower the cost/ton to 98.5.
While reducing cycle time would lower the cost/ton to 90.0.
What we learn from this example is that it is far more effective to work on improving cycle time than lowering fuel consumption. Reducing fuel consumption by 10% is, arguably, difficult to do and will only reduce the cost/ton by 1.5%. But, without any additional capacity cost (outside of perhaps an operator trainer) a 4.5-second improvement in cycle time has the potential to lower cost/ton by 10%.
Understanding what changes can make the biggest impact on your production is the quickest way to improve your productivity. If you want to learn more about how BSG can help your operation become more productive, please contact us at bsg@komatsuna.com.
Blog Author:

Craig McGinnis
Manager, Business Solutions Group
Komatsu America
https://www.komatsuamerica.com/blogs/2020-02-17-business-solutions-group-1